What are the Carbon emissions of Enhanced Rock Weathering?
A comprehensive, transparent, and rigorously conducted LCA is the basis for every high-quality carbon removal technology and its carbon removal credit issuance. We have thus – for the first time ever in a tropical context – conducted a cradle-to-grave LCA for ERW based on regional and primary gathered data. The total emissions created through every operational stage are only 7.36% or (20.14 kg CO2-eq) of the basalt rock powder’s overall CDR potential that we applied in this context. More importantly, the massive reservoirs of usable rock by-products in Brazil combined with the favorable renewable energy mix bear significant potential to reduce emissions even further.
This article outlines how we calculate the Greenhouse Gas (GHG) emissions created through our rock powder sourcing, transport, and spreading in São Paulo (Brazil). It describes how the emissions were calculated, relates them to the overall CO2 removal potential of our rock powders, and outlines Brazil’s unique potential for low-emission processes.
Why do we need an LCA?
In order to gain net Carbon Dioxide Removal (CDR) estimates from Enhanced Rock Weathering (ERW), GHG emissions at every operational stage must be accounted for. This ensures the operation is net negative for CO2 emissions and presents a safeguard for establishing responsible CDR projects. Operational emissions (often referred to as embodied emissions) are typically estimated via a life cycle assessment (LCA) and must be in accordance with strict ISO standards. However, such GHG calculations have mostly been conducted at the national or global level (e.g. Moosdorf et al, 2014) and are based on averaged database values, whereas regional-specific assessments with primary data are currently missing. Therefore, we hereby present an LCA case study based on primary and regional-specific data of our operations in one of our projects in São Paulo, Brazil. Our attributional (vs. consequential) LCA builds on the foundation of previously published work by Lefebvre et al. (2019), representing one of the first and most comprehensive EW-specific LCAs developed which was also specific to one of our primary rock powder suppliers. Here we outline the LCA process and demonstrate the integration of the pioneering work of Lefebvre et al., with our own operational data.
System Boundaries and emissions of major process stages
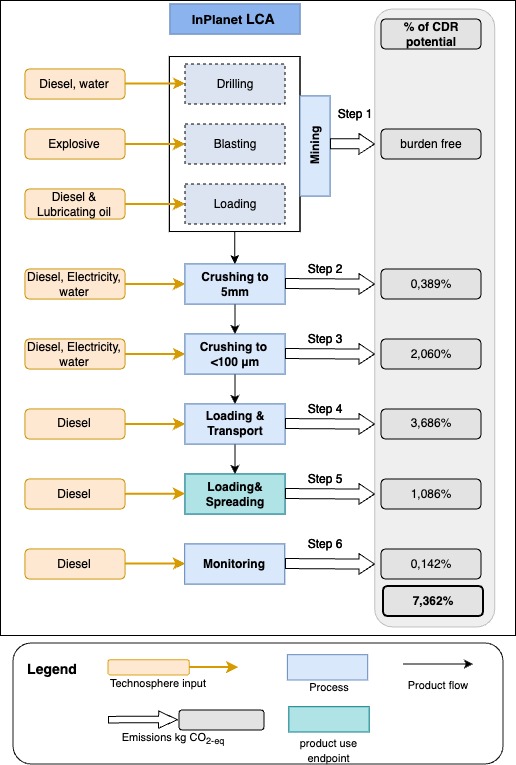
For a proper accounting of our emissions, all operational stages must be included. In Fig.1, we outline our system boundaries and the emissions of each operational step – expressed as a percentage of our rock powder’s overall CDR potential (the maximum amount of CDR possible based on the chemistry of the rock powder). We calculated CO2 emissions either directly through primary data or through regionally available data. Both the mining and crushing stage are calculated based on the most comprehensive rock powder LCA currently available (Lefebvre et al., 2019), which builds on regionally available mining data that were additionally backed up by cross-industry calculations with the bond mining index (Metso, 2015).

Mining
Mining involves the initial extraction of the rocks through drilling and blasting operations, including the transport of these coarse rock fragments to the crushing site. Importantly, here and for all other stages, we also include other GHGs, which are eventually converted into CO2-equivalents. This corresponds to what is called the “functional unit” of an LCA, which would be kg CO2-eq emitted per ton of basalt powder applied, in our operations, at a rate of 10t/ha.

Crushing
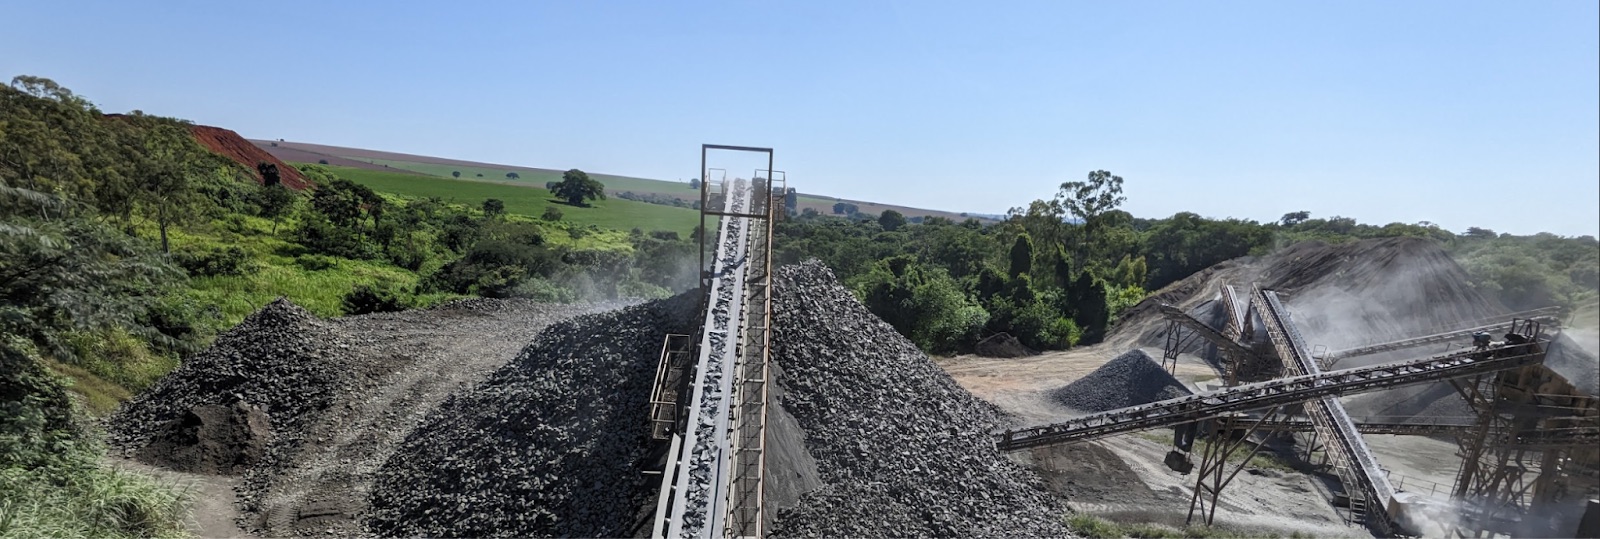
Crushing of the coarse rock fragments typically involves various stages, like primary, secondary, and tertiary crushers, which are connected by various conveyor belts, all of which are accounted for in our calculations. During the mining operation, rock particles with a size of 5mm and smaller (step 2 in Fig.1) accumulate as a natural by-product of the mining process. These are then further crushed to smaller particle sizes (step 3 in Fig.1). Although these calculations already have a high degree of robustness, they will be improved with continuously updated mining data and operation changes.

Loading and Transport
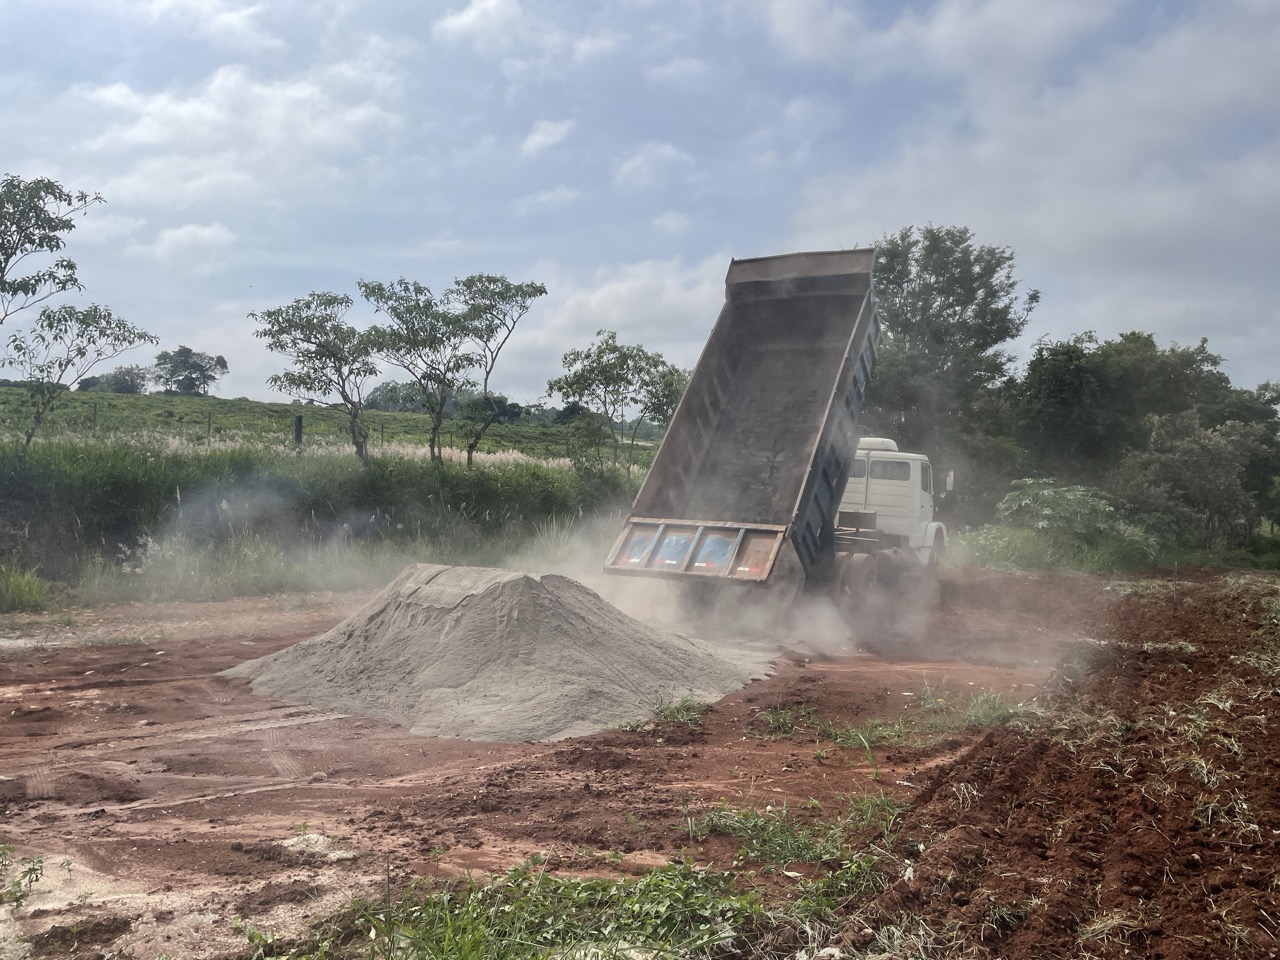
This stage includes all major and minor loading and transport steps along the life cycle of rock powder production and delivery to the final application site. On the mining site, rock fragments are loaded from the mining area to the crushing site and from the crushing to the final transportation trucks. Transportation is a major emissions source that can dictate the viability of ERW operations (Lefebvre et al., 2019), depending on the distance from the mine to the field. To ensure transport emissions are kept to a minimum, we only work with farms that are within 100 km of the mine. We furthermore calculate our LCA through primary GPS and fuel tracking data of each individual truck delivering rock powder from the mine to the field (and back to the mine, since we also account for the CO2 emissions of the empty truck going back). Importantly, with an almost equal share of bioethanol to gasoline, Brazil is considered the world’s first “sustainable” biofuel economy and the biofuel industry leader. This is not yet accounted for in the current LCA and bears significant potential to lower the CO2 emissions even further

Spreading
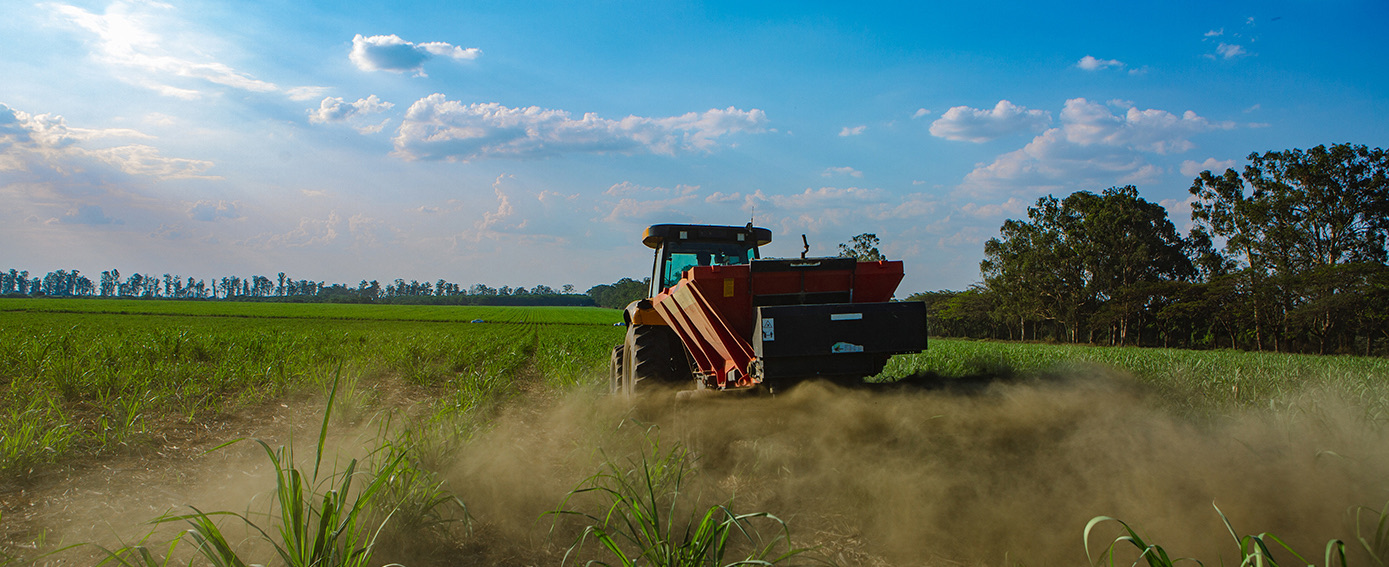
CO2 emissions of our spreading activities are derived from primary data, again a major advantage for accurate LCA quantification. Each single rock powder spreading tractor is GPS tracked on the field, providing a verifiable database for operations and a quality control mechanism for our MRV. For our specific CO2-eq calculation, we include the tractor type and its respective emission factor, diesel consumption, and the spreader efficiency in tons of rock powder per hour per hectare.
Monitoring
We include emissions derived from monitoring our operations. These emissions occur from fortnightly drives to the field and back, where we sample liquids, conduct gas measurements, and overall check if the experiments are running well.
LCA validation
Our LCA was developed in consultation with David Lefebvre and in cooperation with Newcastle University. With Newcastle University, we are currently in the process of calculating the crushing (1.1) and mining (1.2) part of our LCA with primary data. This will be accompanied by an assessment of all relevant cradle-to-grave emissions, which may include scope 3 and embedded emissions, after which we pursue ISO compliance.
Brazil’s specific sustainability potential
We currently use rock powders that are by-products of the mining industry and could thus be considered either emission ‘burden-free’ (Puro.earth, 2022) or apportioned emissions (Isometric, 2023). Burden-free accounts for 20.14 kg CO2-eq or 7.36% of our rock powder’s overall CDR potential. At a later stage, our operations may require rock powder quantities beyond what can be provided from by-products. Including the crushing and mining stage in our LCA yields total emissions of 23.08 kg CO2-eq (8.44% of the rock’s CDR potential). Nevertheless, an internal analysis identified a substantial reservoir in Brazil’s range of gigatons of rock powder residues, which is more than sufficient for our current operations.
Furthermore, we also take a conservative approach regarding the provided energy mix itself. Our current emission factors do not reflect Brazil’s favourable position with a high proportion of hydropower for the national energy mix, potentially further decreasing LCA impacts for ERW (Eufrasio et al., 2022). This makes the current LCA a conservative estimate and future iterations of the LCA will better quantify such energy contributions.
Conclusion and Takeaway
A comprehensive, transparent, and rigorously conducted LCA is the basis for every high-quality carbon removal technology and its carbon removal credit issuance. We have thus – for the first time ever in a tropical context – conducted a cradle-to-grave LCA for ERW based on regional and primary gathered data.
The total emissions created through every operational stage are only 7.36% or (20.14 kg CO2-eq) of the basalt rock powder’s overall CDR potential that we applied in this context. More importantly, the massive reservoirs of usable rock by-products in Brazil combined with the favorable renewable energy mix bear significant potential to reduce emissions even further.
References
Lefebvre, D., Goglio, P., Williams, A., Manning, D.A., de Azevedo, A.C., Bergmann, M., Meersmans, J. and Smith, P., 2019. Assessing the potential of soil carbonation and enhanced weathering through Life Cycle Assessment: A case study for São Paulo State, Brazil. Journal of Cleaner Production, 233: 468-481
Eufrasio, R.M., Kantzas, E.P., Edwards, N.R., Holden, P.B., Pollitt, H., Mercure, J.-F., Koh, S.L. and Beerling, D.J., 2022. Environmental and health impacts of atmospheric CO2 removal by enhanced rock weathering depend on nations’ energy mix. Communications Earth & Environment, 3(1): 106
Metso, “Basics in minerals processing,” p. 354, 2015.
Puro.earth, 2022. Enhanced Rock Weathering Methodology, https://carbon.puro.earth/enhanced-rock-weathering.
Revision
This article is a revision from our first LCA case study published in November 2023.